WinFormsのChartコントロールをWPFで試してみます。
プロジェクトにパッケージの追加
dotnet add package System.Data.SqlClient
dotnet add package System.Windows.Forms.DataVisualization --prerelease
ソースコード
ファイル名:App.xaml.cs
using System.Configuration;
using System.Data;
using System.Windows;

namespace WpfChartSample;

/// <summary>
/// Interaction logic for App.xaml
/// </summary>
public partial class App : System.Windows.Application
{
}
/*
public partial class App : Application => System.Windows.Application
*/
Application部分を変更
ファイル名:MainWindow.xaml
<Window x:Class="WpfChartSample.MainWindow"
        xmlns="http://schemas.microsoft.com/winfx/2006/xaml/presentation"
        xmlns:x="http://schemas.microsoft.com/winfx/2006/xaml"
        xmlns:d="http://schemas.microsoft.com/expression/blend/2008"
        xmlns:mc="http://schemas.openxmlformats.org/markup-compatibility/2006"
        xmlns:wf="clr-namespace:System.Windows.Forms.Integration;assembly=WindowsFormsIntegration"
        xmlns:local="clr-namespace:WpfChartSample"
        mc:Ignorable="d"
        Title="MainWindow" Height="450" Width="800">
    <Grid>
        <wf:WindowsFormsHost x:Name="ChartHost"/>
    </Grid>
</Window>
ファイル名:MainWindow.xaml.cs
using System.Windows;
using System.Windows.Forms.DataVisualization.Charting;

namespace WpfChartSample;

public partial class MainWindow : Window
{
    public MainWindow()
    {
        InitializeComponent();

        // グラフ用配列
        List<int> values = [0,10,20,30,40,50,];

        var chart = new Chart();
        chart.Dock = System.Windows.Forms.DockStyle.Fill;

        // チャートエリアの追加
        var chartArea = new ChartArea("area");
        // 最大値
        chartArea.AxisY.Maximum = values.Max() + 10;
        chart.ChartAreas.Add(chartArea);

        // グラフの追加
        var series = new Series("data");
        // 縦棒グラフ
        series.ChartType = SeriesChartType.Column;

        // 配列の値をグラフにセット
        foreach(var v in values)
        {
            series.Points.AddY(v);
        }

        chart.Series.Add(series);

        ChartHost.Child = chart;
    }
}

/*
dotnet add package System.Data.SqlClient
dotnet add package System.Windows.Forms.DataVisualization --prerelease
*/
ファイル名:WpfChartSample.csproj
<Project Sdk="Microsoft.NET.Sdk">

  <PropertyGroup>
    <OutputType>WinExe</OutputType>
    <TargetFramework>net10.0-windows</TargetFramework>
    <Nullable>enable</Nullable>
    <ImplicitUsings>enable</ImplicitUsings>
    <UseWPF>true</UseWPF>
    <UseWindowsForms>true</UseWindowsForms> <!-- WinFormsのコントロールの参照用 -->
  </PropertyGroup>

  <ItemGroup>
    <PackageReference Include="System.Data.SqlClient" Version="4.9.1" />
    <PackageReference Include="System.Windows.Forms.DataVisualization" Version="1.0.0-prerelease.20110.1" />
  </ItemGroup>

</Project>
実行
dotnet runスクリーンショット
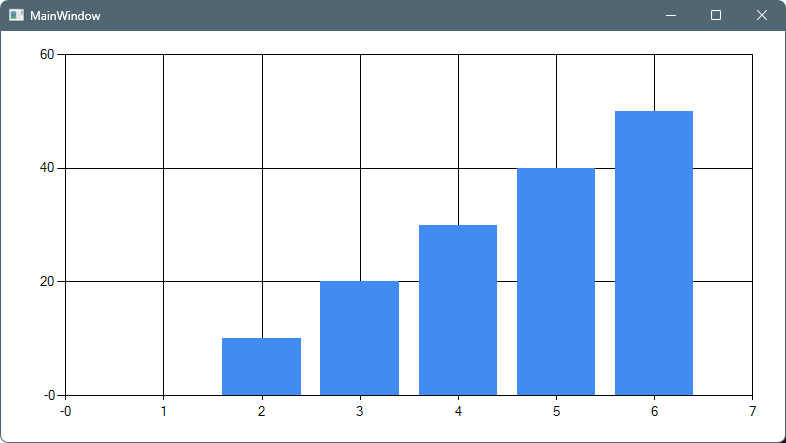
感想
導入に少し手間取りましたが、動作を確認。
パッケージのメンテナンス状況が不明ですが、
個人的に使う分には問題なさそうですね。
ただ、WinFormsのコントロールなのでデータバインディングには多分対応していないと思われます。
自前でAttachedPropertyでDPを生やして上げる必要がありそうです。(出来るか未確認)

コメント