画像のヒストグラムをグラフで表示します。
パッケージの追加
dotnet add package System.Windows.Forms.DataVisualization --version 1.0.0-prerelease.20110.1
dotnet add package System.Data.SqlClient
ソースコード
ファイル名:Form1.Hist.cs(新規追加)
using System.Windows.Forms.DataVisualization.Charting;
using System.Windows.Forms.VisualStyles;
using OpenCvSharp;
using OpenCvSharp.Extensions;

namespace GazouKakou02;
public partial class Form1 : Form
{
    // メニュー項目
    readonly ToolStripMenuItem histMenuItem  = new()
    {
        Text = "ヒストグラム",
    };

    /// <summary>
    /// ヒストグラムの初期化
    /// </summary>
    public void Init_Hist()
    {
        // メニューの登録
        filterMenuItem.DropDownItems.Add(histMenuItem);

        const int BORDER_WIDTH = 3;
        const string filterName = "ヒストグラム";


        // メニューアイテムのクリックイベント
        histMenuItem .Click += (s, e) =>
        {
            if (_buffBmp is null) return;


            Form frm = new()
            {
                FormBorderStyle = FormBorderStyle.FixedDialog,
                ClientSize = new System.Drawing.Size(640, 480),
                Text = filterName,
            };
            Chart chart = new()
            {
            Dock = DockStyle.Fill,
            Parent = frm,
            };
            // デフォルトグラフをクリア
            chart.Series.Clear();
            chart.ChartAreas.Clear();

            // チャートエリアの追加
            chart.ChartAreas.Add(new ChartArea("area1"));

            using Mat srcMat = BitmapConverter.ToMat(_buffBmp);

            if (srcMat.Channels() == 1)
            {
                // グレースケール

                // グラフを追加
                chart.Series.Add("grayscale");
                // 縦棒グラフ
                chart.Series["grayscale"].ChartType = SeriesChartType.Line; // 折れ線
                chart.Series["grayscale"].BorderWidth = BORDER_WIDTH;
                chart.Series["grayscale"].Color = Color.Black;

                // ヒストグラム
                Mat hist = new();
                Cv2.CalcHist([srcMat], [0], null, hist, 1, [256], new Rangef[] { new(0, 256) });

                // Chartに配列をセット
                for(int i = 0; i < 255; i++)
                {
                    chart.Series["grayscale"].Points.AddY(hist.At<float>(i, 0));
                }

            }
            if (srcMat.Channels() >= 3)
            {
                // カラー

                // グラフを追加
                chart.Series.Add("blue");
                chart.Series["blue"].ChartType = SeriesChartType.Line;
                chart.Series["blue"].BorderWidth = BORDER_WIDTH;
                chart.Series["blue"].Color = Color.Blue;
                Mat hist_b = new();
                Cv2.CalcHist([srcMat], [0], null, hist_b, 1, [256], new Rangef[] { new(0, 256) });

                chart.Series.Add("green");
                chart.Series["green"].ChartType = SeriesChartType.Line;
                chart.Series["green"].BorderWidth = BORDER_WIDTH;
                chart.Series["green"].Color = Color.Green;
                Mat hist_g = new();
                Cv2.CalcHist([srcMat], [1], null, hist_g, 1, [256], new Rangef[] { new(0, 256) });

                chart.Series.Add("red");
                chart.Series["red"].ChartType = SeriesChartType.Line;
                chart.Series["red"].BorderWidth = BORDER_WIDTH;
                chart.Series["red"].Color = Color.Red;
                Mat hist_r = new();
                Cv2.CalcHist([srcMat], [2], null, hist_r, 1, [256], new Rangef[] { new(0, 256) });

                Mat hist_a = new();
                if (srcMat.Channels() == 4)
                {
                    chart.Series.Add("alpha");
                    chart.Series["alpha"].ChartType = SeriesChartType.Line;
                    chart.Series["alpha"].BorderWidth = BORDER_WIDTH;
                    chart.Series["alpha"].Color = Color.Black;
                    Cv2.CalcHist([srcMat], [3], null, hist_a, 1, [256], new Rangef[] { new(0, 256) });
                }

                for(int i = 0; i < 255; i++)
                {
                    chart.Series["blue"].Points.AddY(hist_b.At<float>(i, 0));
                    chart.Series["green"].Points.AddY(hist_g.At<float>(i, 0));
                    chart.Series["red"].Points.AddY(hist_r.At<float>(i, 0));
                    if (srcMat.Channels() == 4)
                    {
                        chart.Series["alpha"].Points.AddY(hist_a.At<float>(i, 0));
                    }
                }
            }
            frm.ShowDialog();
        };
    }
}
実行
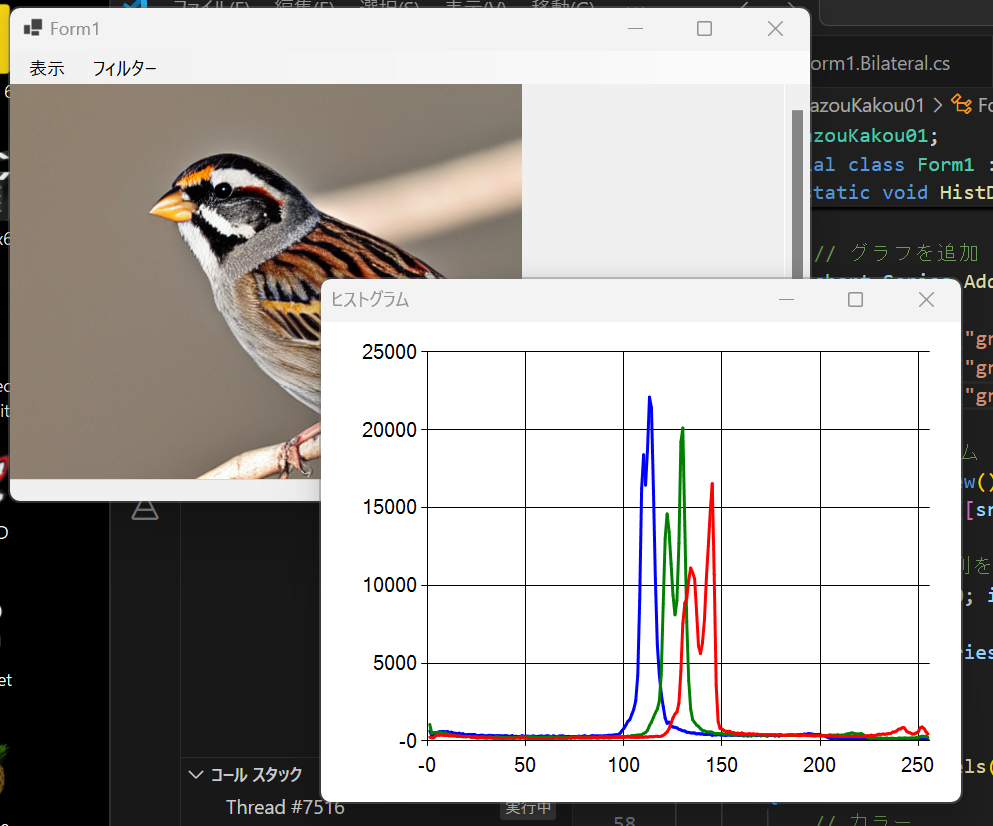
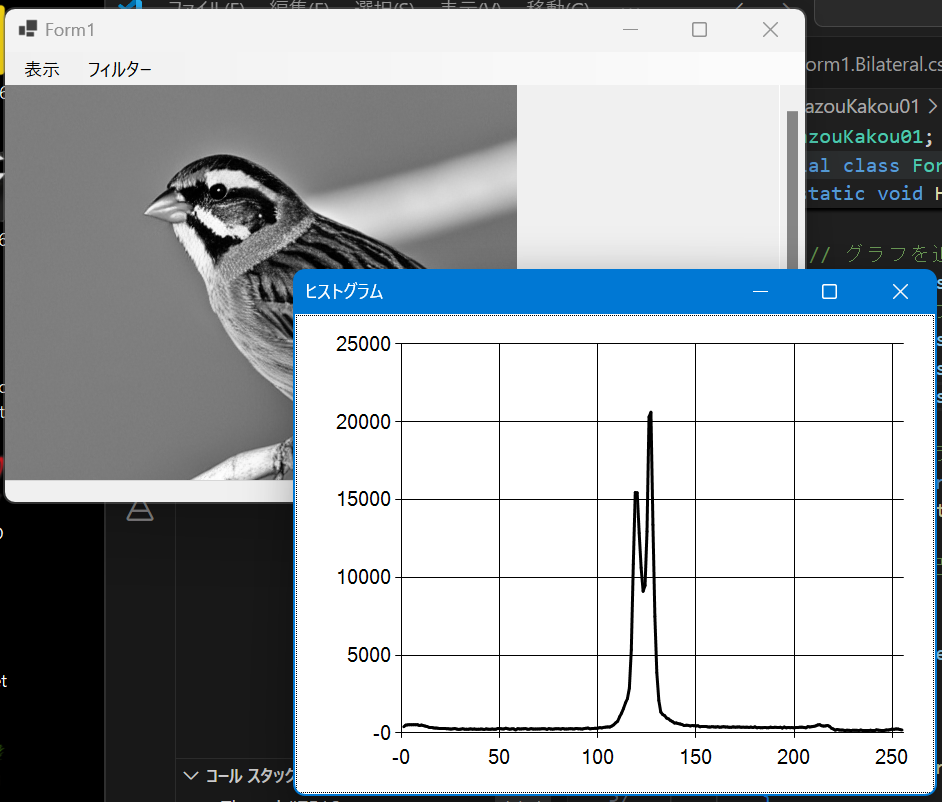
画像が表示されている状態でメインメニュー「フィルター」→「ヒストグラム」を選ぶ
カラー画像の場合、各チャンネルが青、緑、赤の折れ線グラフで表示(アルファチャンネルは黒)
グレースケール画像の場合、黒色の折れ線グラフで表示

コメント